

Python-連O鈞-電商消費者採購分析
- Tw Tedu

- 2021年11月2日
- 讀畢需時 2 分鐘
已更新:2021年11月10日

專案動機
曾看過Youtube上有人介紹自己的工作是分析師,可以幫公司找出銷售策略、調整公司制度或規則以達到更好的業績或是改善公司某方面的狀況,比如預測客戶的流失量等。
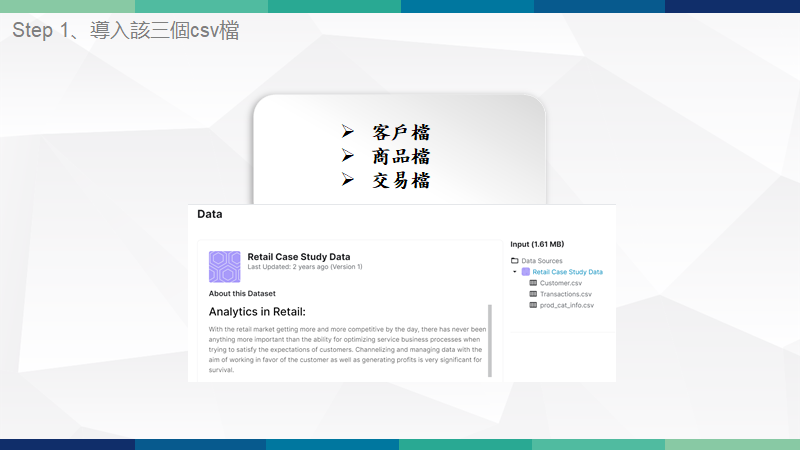
我認為有能力將資料進行分析,並將得到的數字進行解釋,應用在各種產業中是很厲害的事,而且電商是現在的趨勢,大部分的人都會透過網路購物,並累積大量的數據,根據這些想法,就在Kaggle上找到相關數據集,開始了這個預測客戶購買力的專案主題。
分析報告


重點技術
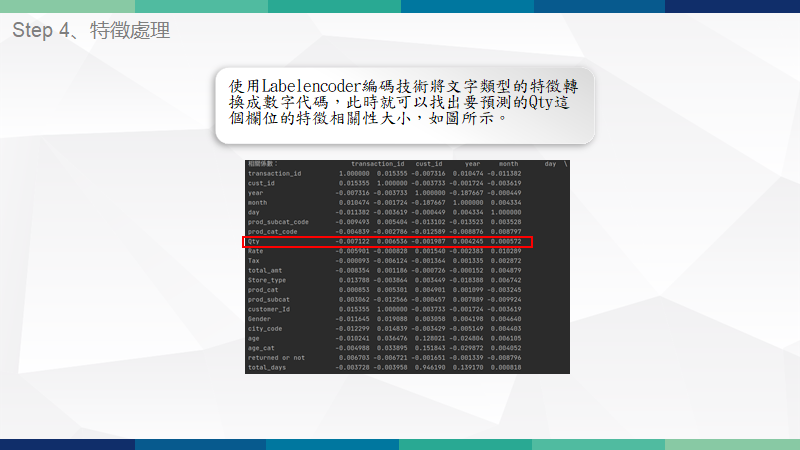
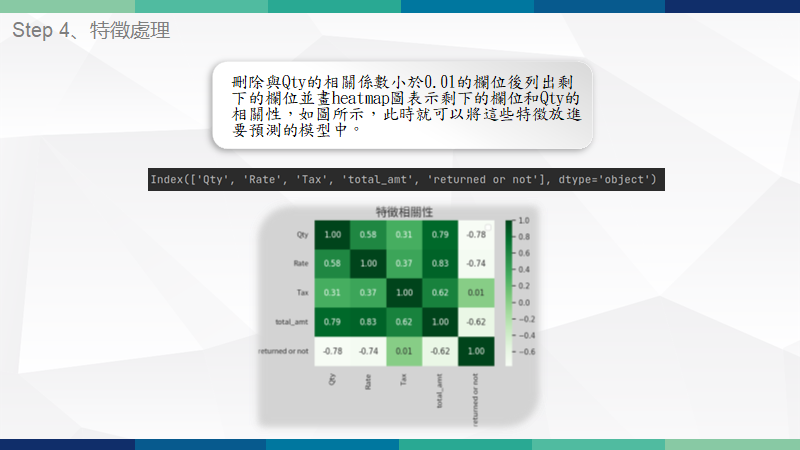
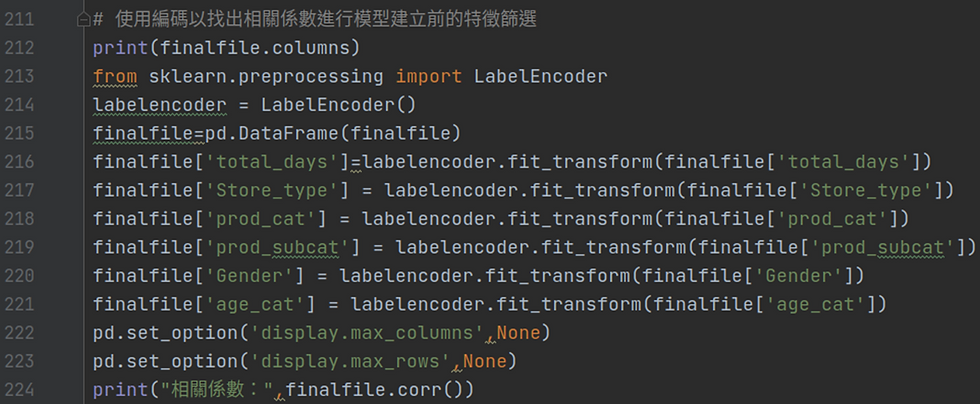
Labelencoder標籤編碼
為了瞭解各個特徵間的相關性,使用編碼替代文字型態的欄位,再以corr列出finalfile這個表的相關係數,得知與Qty最相關、要應用於模型的欄位有哪些後刪除相關性小的欄位,進而建立隨機森林模型。
建立隨機森林模型(Random Forest)
一個包含多棵決策樹的模型
可處理連續型資料亦可處理離散型的資料,更可以處理高維度的特徵資料。
比起選擇決策樹,隨機森林的準確度較高。


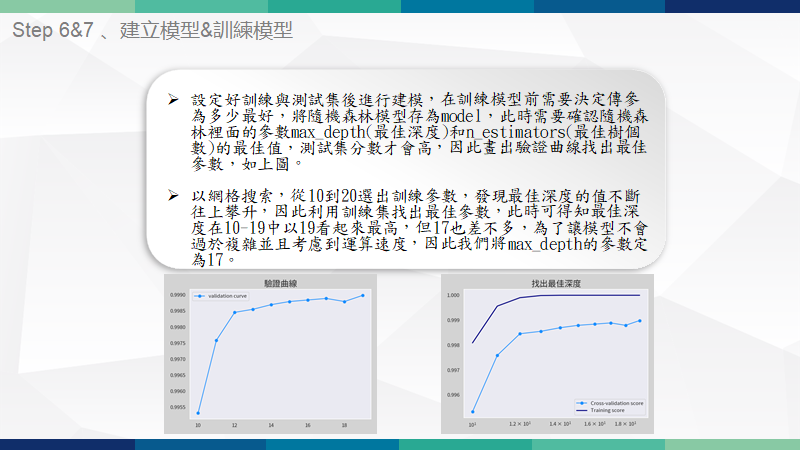
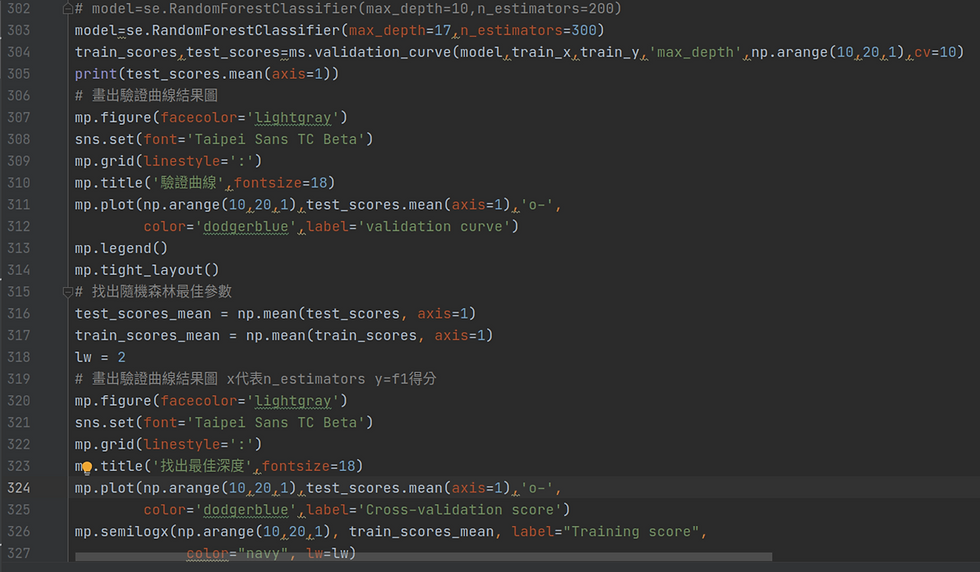
繪製驗證曲線-1
利用驗證曲線圖找出最佳的max_depth,右圖可見曲線不停攀升,因此利用訓練集去找出最佳的max_depth。
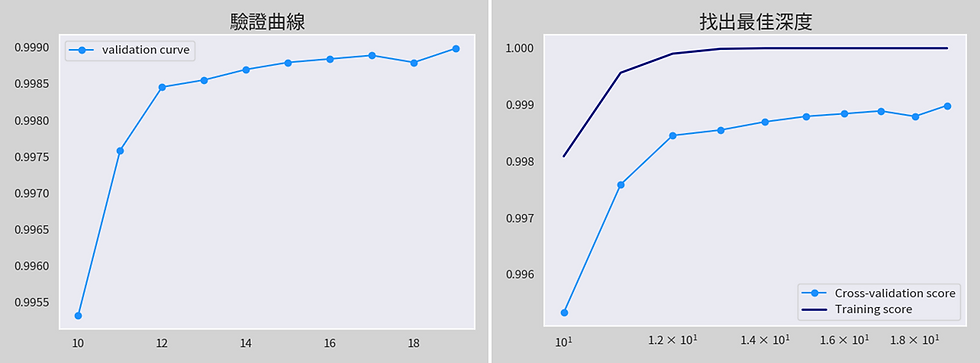
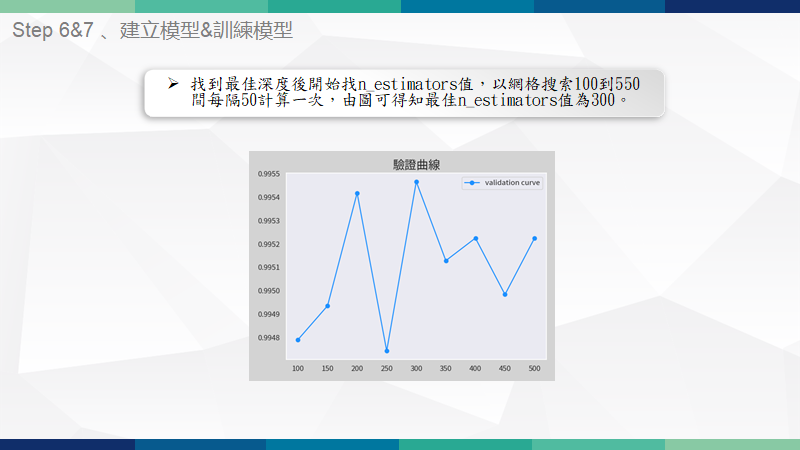
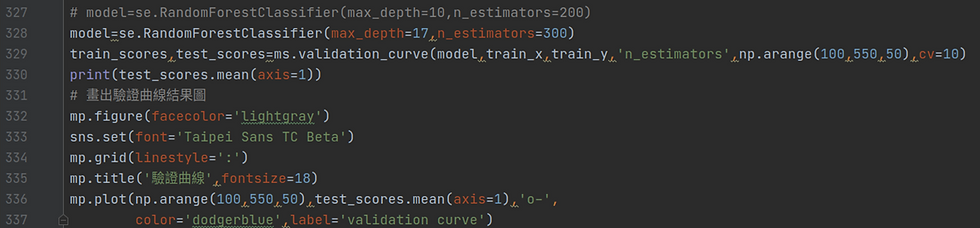
繪製驗證曲線-2
找到最佳深度後開始找n值,以往格搜索100到550間每隔50計算一次,由圖可得知最佳n值為300。

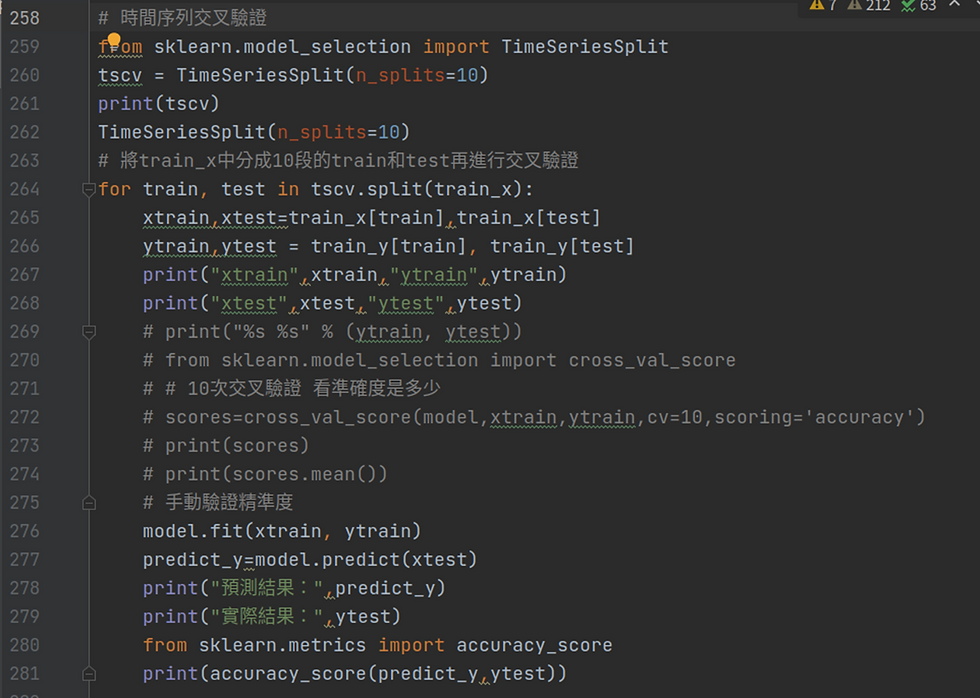
時間序列交叉驗證
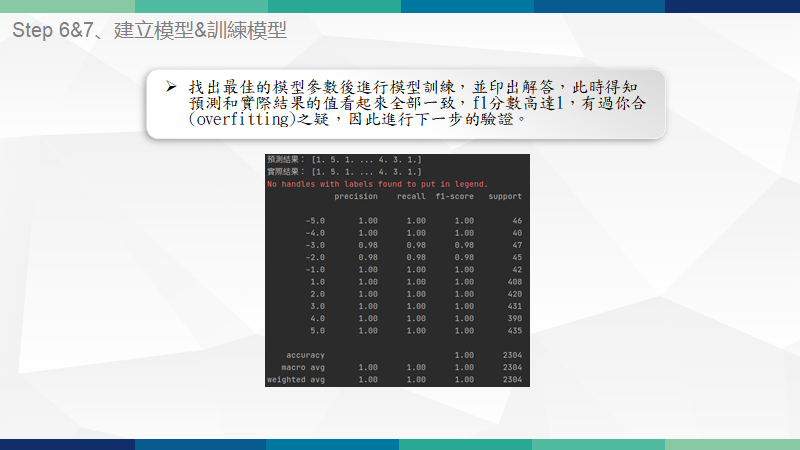
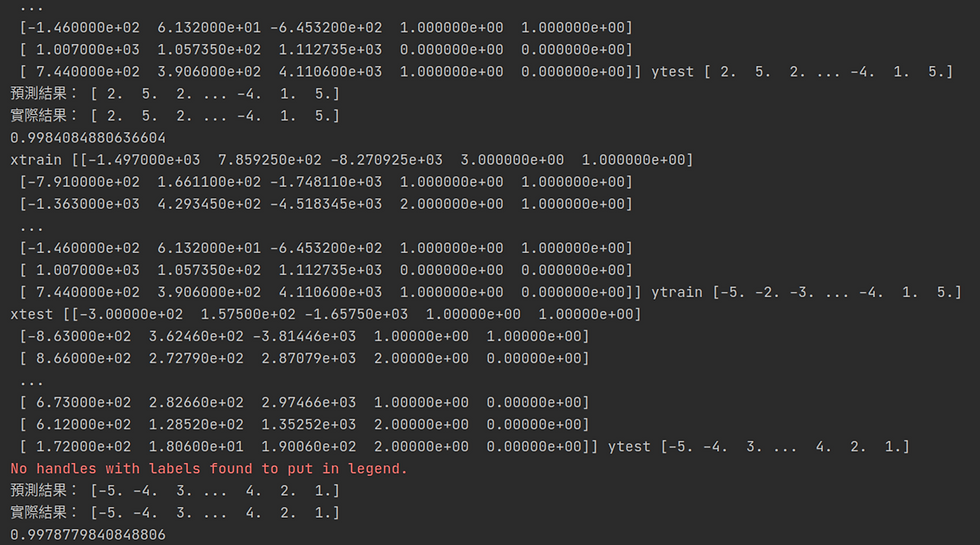
在隨機森林模型進行fit後的f1分數接近1,有過擬合(Overfitting)的可能
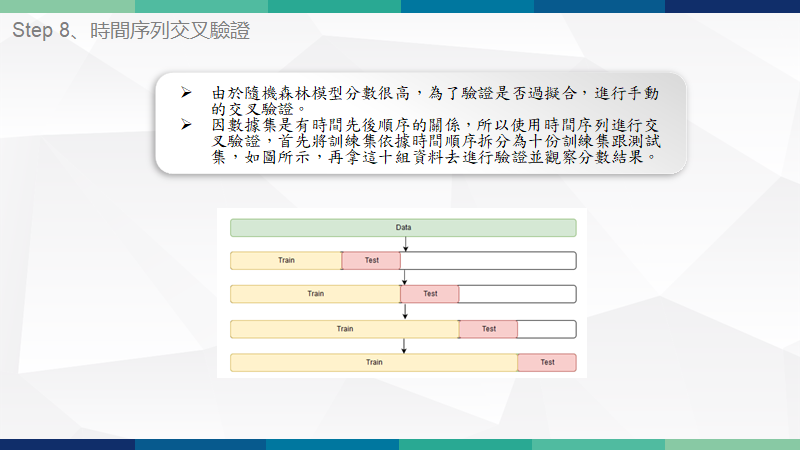
又由於該資料集有時間順序,因此使用時間序列分割 ( TimeSeriesSplit )將訓練集中的資料按照時間順序再分為十份後進行手動的交叉驗證,發現還是f1分數接近1。
結論
當f1分數接近1的代表模型預測越為精準(接近100%)
但同時模型過於精準的預測,其實讓也讓人產生懷疑
所以此時需要進一步的來進行時間序列的交叉驗證
當我們進行10次之後的結果發現:分數還是相當接近於1
所以可以確立模型精準度,跟可實用性,因此這個模型適合用來預測未來的銷售狀況。
專案心得&回饋
透過這次的專案我深切感受到數據背後的價值,在資訊爆量的世代,了解數字背後的意義是各個產業都需要的技能,不只能改善行銷策略也能應用在許多地方,比如AI人工智慧、網頁全端的應用等,此次專案目的是預測銷售量,剛好遇到了過擬合的問題,了解了如何驗證和解決。
很感謝Mike老師的指導,期許自己在未來工作中能透過達內給予的基礎進而強化自己的技術並接觸更多類型的案子。


留言